Introduction
Car navigation software greatly assist drivers. It helps navigate in unfamiliar areas and bypass traffic jams. This is a result of big work of people from around the world, which made our lives easier. But we can not rest on our laurels, technology go ahead and quality of the programs should also grow.
Today, in my opinion, one of the problems of navigation devices - is that they do not suggest driver which traffic lane should be taken. This problem increases travel time, traffic jams and accidents. Google maps recently started to display traffic lanes for turns, it is a good result, but there is much to improve. The maps do not know on what lane the car is and it is hard to find it out with means of gps as it has too big inaccuracy. If we knew the current lane, we would know the speed of movement for each of lanes and we could suggest user which lane should be taken. For example, a navigator could say “continue to keep this lane until the intersection” or “take the left lane.”
In this article we will try to tell how we are trying to determine the lane changes, the current lane, overtakes and other maneuvers using machine learning and accelerometer with gyroscope (the sensors that every modern mobile phone has).
Lane change recommendation could be not only if the speed on the lane is slow due to the fact that cars turn from this lane. Also lane change could be recommended if there is an accident on this lane. Currently, accidents and other problems are mostly provided manually by users in navigation software. Using this algorithm, it would be possible to provide accidents automatically, looking at the maneuvers of cars. If cars in the same place massively make an obstacle avoidance, it seems, that there was an accident or other problem. A server could aggregate these events from vehicles and automatically add road difficulties to maps. The system could alert drivers to change lanes in advance.
How could those problems be solved?
Me and several students of Computer Science Center in Saint-Petersburg, make an open source project, that detects car maneuvers using accelerometer and gyroscope. In the end, we want to make a library with an open source license, which processes the input data from the sensors of a mobile phone or any other device and outputs events such as lane changes, overtakes, obstacle avoidance, turns and u-turns. The only thing that the users of library will need to do is to implement a switch in their program and react to certain events.
The library, in theory, could be used not only by phones, but also, for example, by devices based on microcontrollers that monitor vehicles. I have to say that we are in the middle of the road and there is no assurance that we will be able to identify all the events, but for now it seems like we could succeed.
How do maneuvers look like at a chart?
The events are marked with dashed vertical lines:
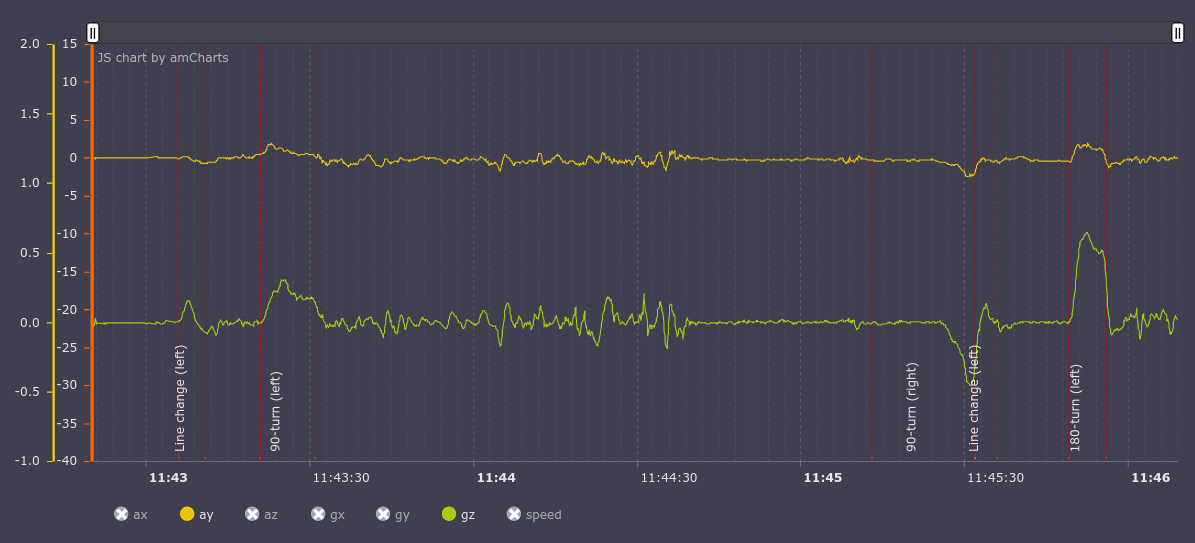
Let’s leave only y accelerometer axis (lateral acceleration, top graph) and the z gyroscope axis (car rotation, top view, bottom graph) active. It can be seen that u-turns and turns are accompanied by increased lateral acceleration and rotation around the z axis. During lane change gyroscope and accelerometer quickly change their values from positive to negative.
It seems that the person looking at these graphs can more or less understand what type of events took place. A classification algorithm based on machine learning can presumably make it too.
What has already been done
We gathered the original data: it is about 1000 kilometers of video and telemetry data gathered with a phone on the roads. It is available here and can freely be used in your project if you need it.
We also made dashboard for convenient work with video and data that looks like this:
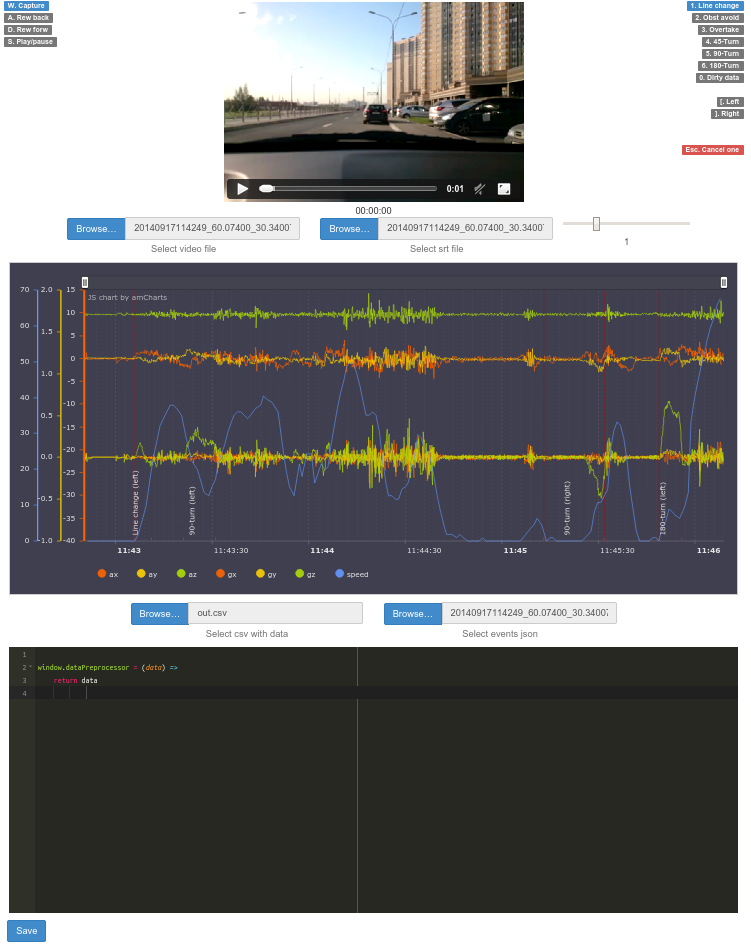
It consists of three parts. At the top there is a video preview with the movement of car. In the center there is a chart in which the data can be viewed: accelerometer, gyroscope, current speed. In the bottom there is a script (coffescript) with the help of which you can modify the data on the fly and display it on the chart (for example, we need a smooth graph).
In addition the dashboard provide an opportunity to mark events on video timeline and save them to a file and then display the marked events on the chart with annotations.
Perhaps some of you in your projects also compare video with sensors data, or just look at the sensor data. If so, the dashboard github.com/blindmotion/dashboard could be useful for you. It is quite easy to use, allows you to scale, transform data on the fly and has an open license, which means you can freely use it and modify.
We made normalizer for accelerometer and gyroscope
The phone can be located arbitrarily inside a car and its position may vary. We need to reduce all data to a common denominator for the model. To do it, we created Normalizer, a library that regardless of the orientation of the device always gives z-axis as perpendicular to the ground, the x-axis coincides with the direction of the vehicle, and the y axis is perpendicular to the direction of motion and is tangent to the Earth. It looks something like this:
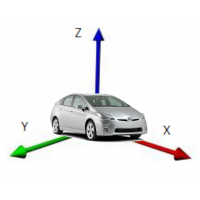
In order for this to work, we first focus on the Earth’s gravity vector and construct a rotation matrix so that our z-axis after the rotation coincides with this vector. Rotation matrix for correct orientation of the x and y is built in a slightly more complicated way. Before normalization the data looks like this:
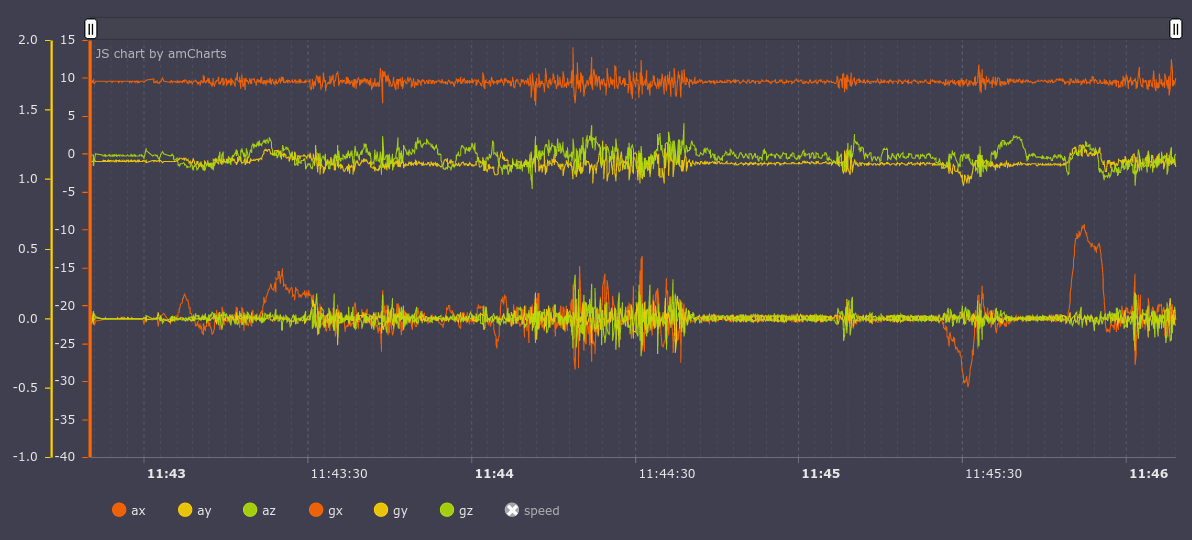
On the accelerometer chart we see that the axis X (ax in the graph; a - accelerometer, g - a gyroscope) has almost constant value approximately equal to 10g, what is wrong, because the X-axis is parallel to the ground. Let’s normalize data and get the following chart:
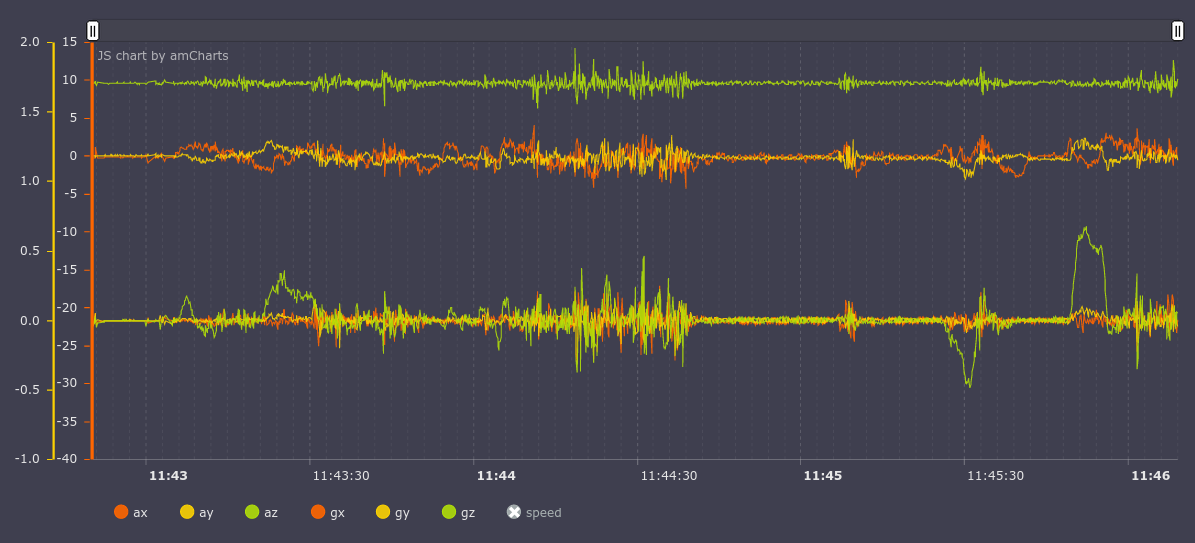
now everything is right, the value on the axis Z (az) is equal to 10g, and X and Y have corresponding values for the vehicle.
The Normalizer can be useful also in other projects associated with processing of data from sensors. If you need you can get the source code here github.com/blindmotion/normalizer
We made classifier
Now we use feedforward neural network with three hidden layers and looks something like this:
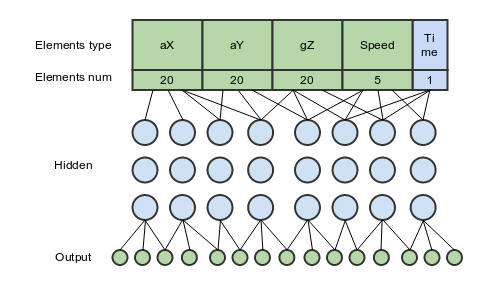
it consists of 66 elements:
20 - accelerometer data for the normalized X-axis (lateral acceleration)
20 - accelerometer data for the normalized Y-axis (frontal acceleration)
20 - gyroscope data for the normalized Z-axis (rotation around the axis that is perpendicular to the ground)
5 - the gps speed
1 - the time of maneuver
In this configuration, at the first glance, the optimal ratio of the input data and results is achieved, although the addition of other axes gives quite better accuracy.
The classifier itself can be found here: github.com/blindmotion/detector
The classifier uses following data samples for learning:
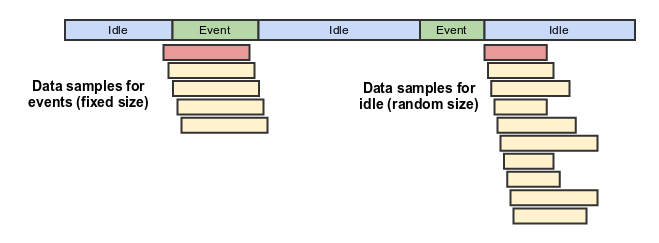
There are two classes of samples: events and idle.
Events is when some maneuver takes place, i.e. lane change. Each event data is interpolated or extrapolated to 20 elements for each axis. Initially, it may have more or less elements, but most likelly more, as the length of maneuver is usually about several seconds and the rate of sensor is quite high.
Idle is when no event is happening and the car is just moving straight or standing.
The duration of sample for event is exactly equal to the duration of the event. The length of idle sample is taken random as in the picture above (right column).
How well does classifier work?
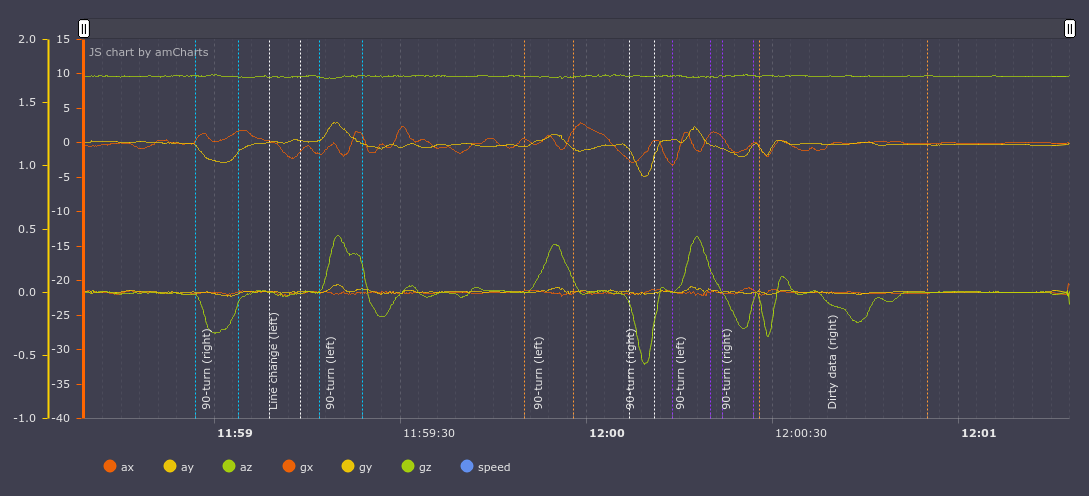
The results can be estimated visually by compairing the events marked by a man and the algorithm.
The events marked by a man:
and the model:
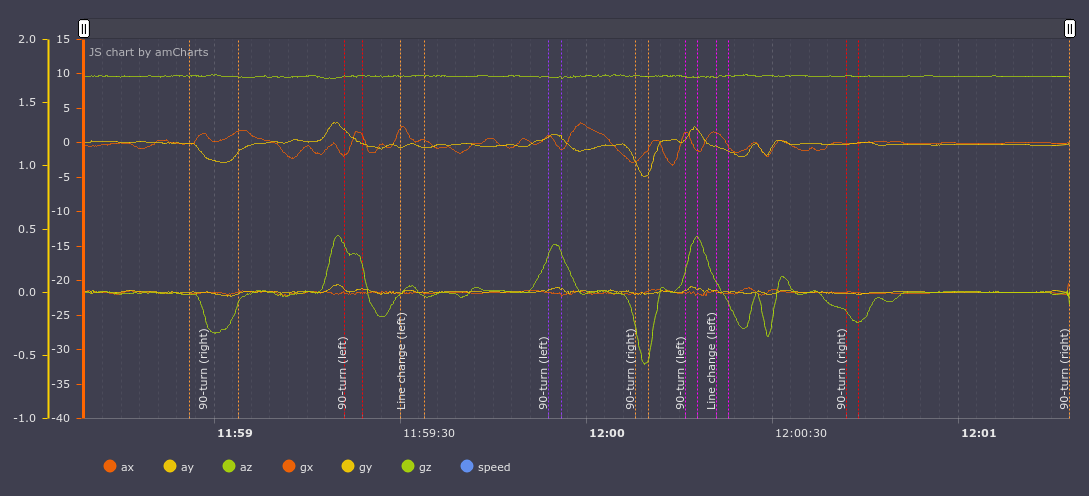
Here we see that the model missed the lane change to the left after the first turn to the right and mistakenly added left lane change after the left turn. But, watching video, this situation seems disputable, the trajectory is really similar to left lane chenge. Here’s a video of this part (best viewed in hd to be able to see the chart):
What is the accuracy of the classifier for test set?
Test set - it is the data on which the model did not learn, and that did not adjusted our model in any way. These are the numbers for all events that have been made by a car in two hours: all lane changes, turns, overtakes.
Correct type:
59 - the number of events that were classified correctly
Wrong type:
16 - the number of events, that was found by the model but with wrong type or direction. For example, a turn was detected instead of lane change or turn left instead of turn right.
False positive:
17 - the number of events that did not actually happen but that were classified by neural network
False negative:
26 - the events that the model created, but that do not exist in fact
Correct percent
0.5 - percentage of accuracy including False negative
0.64 - percentage of accuracy not including False negative. Metric with this approach: “missed something and it’s ok, the main is not to create wrong events”
Of course, the numbers do not yet allow us to speak about the use of the library in real time, but it allows to collect aggregated statistics and to make conclusions on its basis on a server. In terms of real-time, error is still big. Under real, I understand that working on a phone or other device, the algorithm can reliably tell that a car has just made a maneuver. Under the aggregated statistics I understand an algorithm on a server that collects these events from all devices and makes conclusions on its basis. There is a big room for improvement and I think that in 6-9 months, the algorithm may be quite suitable for use.
In the future we want to make a joke application for android that would tell driver what maneuver he just made. For example, it will say “You’ve just turned left”, “You’ve just avoided an obstacle”, “You’ve changed the line to left”. This opensource application may be then used by any person who want to integrate it into his own software: navigator, map or something else.
Where can I find the code and documentation?
The project is located here
github.com/blindmotion/docs/wiki
We would be happy if it is useful for you in some way. It consists of pretty many parts, each in its own repository.